


Weekly Market Commentary September 14, 2026
LPL Research reveals what past rate-hike cycles can teach investors and why today's market backdrop remains supportive.

Last Edited by: LPL Research
Last Updated: September 14, 2026
What History Says About Fed Hikes and Stocks
Friday's slightly hot Consumer Price Index (CPI) report lifted the bond market's odds of a rate hike from the Federal Reserve (Fed) this week to near 90%. The positive reactions from stocks and bonds were interesting, suggesting that perhaps market participants have been more worried about rate hikes than they should have been (though the S&P 500 is only about 2% off its all-time high). In this week's Weekly Market Commentary, we explain how this market reaction makes sense based on history, provide perspective on the latest move up in rates, and share some reasons why the economy is more resilient in the face of rising rates than investors might expect.
Markets Often Shrug Off Hikes
With so much attention focused on what the Fed might do at its policy meeting this week, it's a good time to look back at history to get a sense of how stocks might respond should policymakers hike rates as the market now expects. LPL Research had been characterizing the rate decision as a coin flip until Fed Chair Kevin Warsh's hawkish comments at the Jackson Hole meeting and the strong August jobs report. With the fed fund futures market now pegging the odds of a hike at near 90% following Friday's CPI report, we now expect a hike.
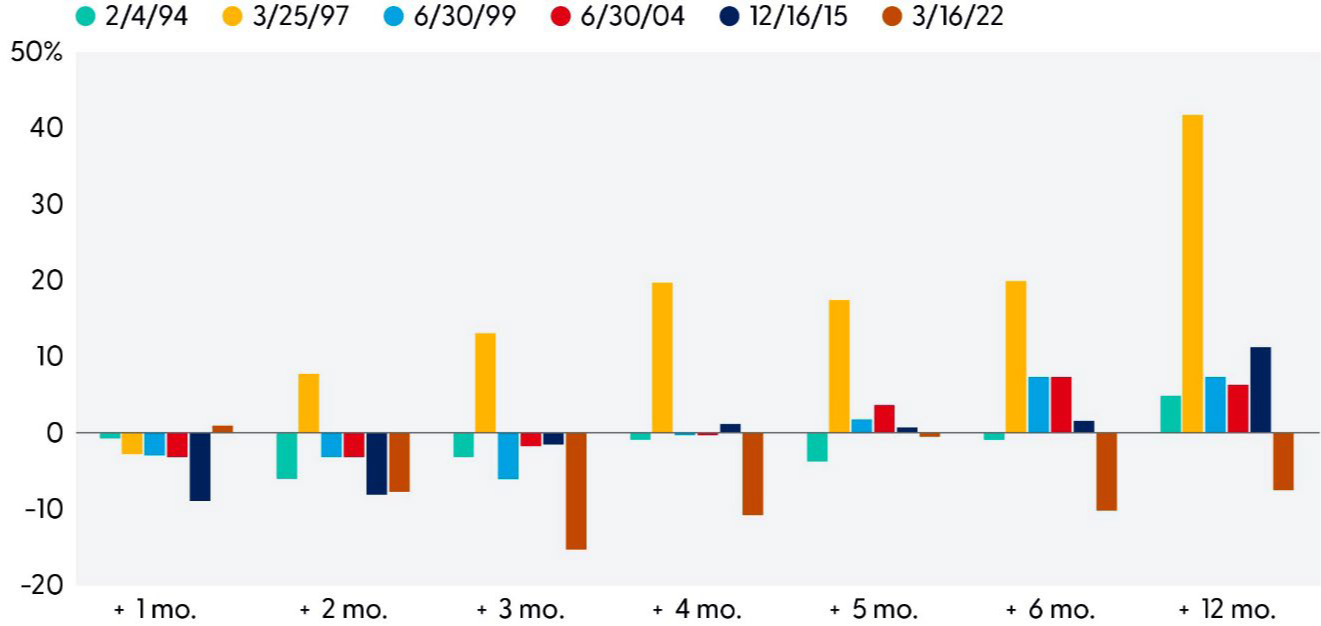
To get a sense of how stocks may react if the Fed does indeed hike rates next week, we looked back at how the S&P 500 performed after initial Fed rate hikes over the past 30 years. As illustrated in the “Initial Fed Rate Hikes Have Generally Been Well Tolerated by the Stock Market” chart, stocks typically struggle for a few months before regaining their footing.
Initial Fed Rate Hikes Have Generally Been Well Tolerated by the Stock Market
S&P 500 performance following initial Federal Reserve rate hikes of prior hiking cycles
Source: LPL Research, Bloomberg 09/03/26
Disclosures: Past performance is no guarantee of future results. All indexes are unmanaged and can't be invested directly.
During the six tightening cycles since 1994, stocks generally struggled during the first several months following the initial rate increase. On average, returns were negative through the first four months before improving significantly by five to six months after the initial hike.
Importantly, those early challenges have not typically translated into longer-term losses. In most cases, equity markets ultimately recovered and delivered healthy returns over the subsequent 12 months as investors adjusted to higher borrowing costs and focused on the underlying strength of the economy and earnings. The average 12-month gain for the S&P 500 post-hike is 6.7%, with a median of 10.7%. It's important to use the median statistic in this case because of the 42% gain in the S&P 500 after the initial rate hike in March 1997. More on that below.
Two Big Outliers
Among these historical analogs, two periods stand out for different reasons. First, the bad news. After the initial hike in March 2022, the S&P 500 fell over the subsequent two months and stayed down for more than 12 months. Stocks faced a uniquely difficult backdrop, with long-term rates rising from severely depressed levels as inflation surged to multi-decade highs following the pandemic. The Fed was late to respond (remember how “transitory” became a bad word?) and was forced to tighten aggressively to catch up. The Fed's poor track record of “hiking until something breaks” left markets fearful that a recession was in the offing. Not only did it feel like a recession to most consumers and investors, but the stock market's 25% drawdown was consistent with one. Although the U.S. economy did not technically enter a recession in 2022, the environment today is clearly much different than it was then.
The second notable exception to the general trends noted above came in 1997, when stocks significantly outperformed the other tightening cycles. Not only was the S&P 500 up nearly 8% two months later as the dot-com boom picked up speed, but a year after that initial hike, the S&P 500 was up 42%! Internet optimism carried the day, not too dissimilar from the Al-driven environment we are in today. In the battle between higher interest rates and revolutionary technologies, technology can win for a while. In fact, another hike in 1999 was followed by another 12-month gain in the S&P 500, reminding us how long the bubble inflated before it eventually popped in the spring of 2000.
Some observers point to the Fed's June 1999 rate hike as a catalyst for the eventual bursting of the bubble. While we would acknowledge that tighter monetary policy likely contributed to market volatility, the enormous level of speculative investment and excessive capital spending would likely have ended that cycle at around the same time regardless of monetary policy actions.
Lessons Learned
The key lesson from these prior cycles is that rate hikes do not typically derail bull markets. When rate increases coincide with rising recession risks, that's a different story. Today, recession risks are low by all accounts. Economic growth remains solid, labor markets remain healthy (as reinforced by last week's jobs report), and inflation, though high, is far below the peaks reached in 2022. Meanwhile, interest rates are already much higher than they were at the start of the last tightening cycle, reducing the shock value for bond portfolios in the case of modest additional increases in market-based rates like the 10-year Treasury.
While we won't forecast a 40% rally in the next year, whether we get a hike this week or not, it's clear to us that the current environment shares more characteristics with the late-1990s experience than the challenges of 2022. While no historical period offers a perfect comparison, today's combination of economic resilience and moderating inflation suggests the backdrop for equities remains supportive. History rhymes. We might get one hike. We might get two. But we won't get 5.25% worth as we did in 2022 and 2023 (that's the equivalent of 21 quarter-point hikes, but who's counting?).
While additional hikes could create periods of volatility, history suggests that strong economic fundamentals can help offset the headwinds from higher rates. During past tightening cycles, stocks often experienced initial turbulence following the initial rate increase before regaining their footing. As long as economic growth remains intact and recession risks stay contained, equity markets have historically been able to move higher even in a rising-rate environment (although past performance does not guarantee future results).
Technical Setup
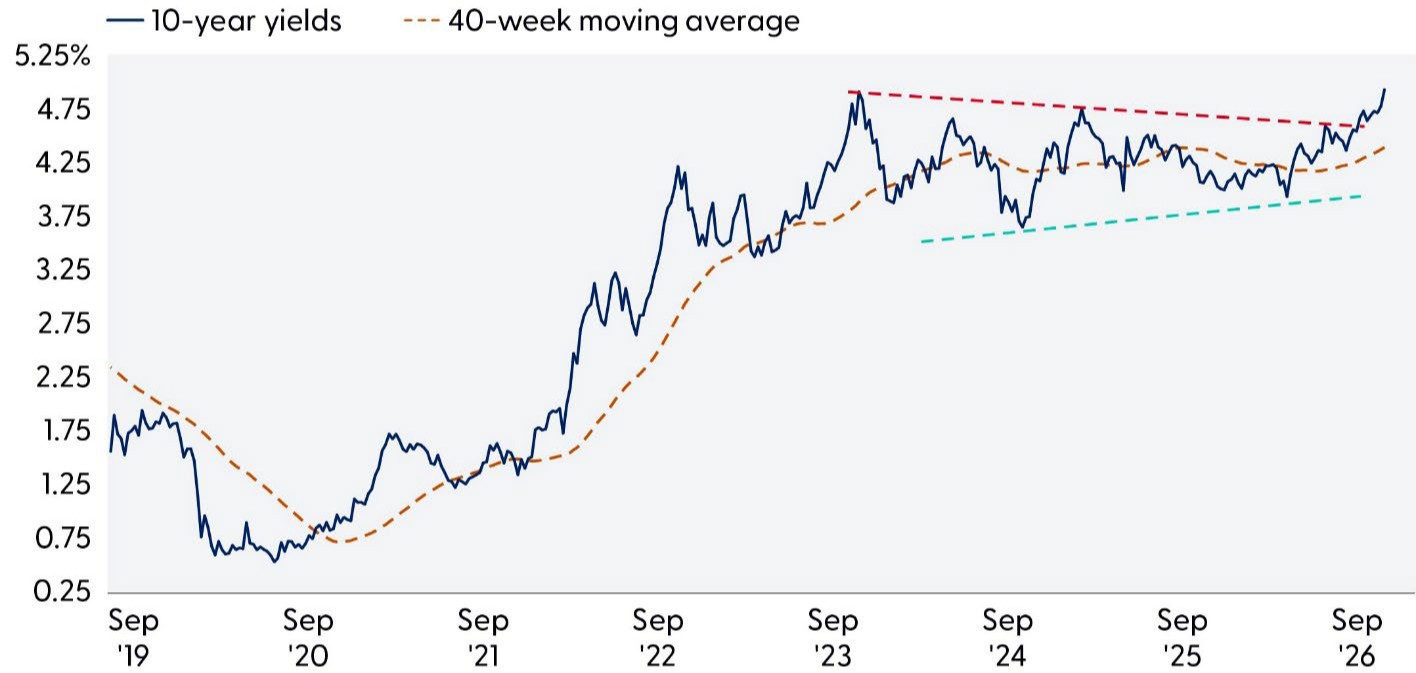
Yields have followed a familiar two steps forward, one step back path for much of the year. Recently, however, rates seem to have ditched the stairs for the elevator. Over the past month, Treasury yields have surged as oil prices broke out to multi-month highs, reigniting inflation concerns. Escalating tensions in the Middle East, lingering supply constraints, and mounting fiscal worries exacerbated by rising debt issuance have only added fuel to the move. Meanwhile, investors have steadily priced in a more hawkish policy outlook, despite limited validation from the Fed and the Treasury's recent efforts to contain upward pressure on rates.
While there is no shortage of narratives explaining why rates are higher, the technical picture has been pretty clear. Benchmark 10-year yields have remained in a steady uptrend since early March, with momentum continuing to build. The recent breakout above the 4.70-4.75% range completed a multi-year consolidation pattern, putting the 5% resistance level squarely in focus. A decisive move above 5% would reinforce the bullish trend in yields and leave the 2006-2007 highs near 5.25-5.35% as the next major resistance hurdle to clear.
For equities, the direction of rates is important, but the speed of the move often matters more. Over the last 20 years, a two-standard-deviation increase in yields over a 20-trading-day period, equivalent to an average rise of 58 basis points, coincided with an average S&P 500 return of -1.0% and an average forward 20-day return of -1.6%. Sharp declines in rates have also been associated with weak concurrent equity performance, though forward 20-day returns have averaged a positive 1.8%.
10-Year Treasury Yields Approach 5%
Source: LPL Research, Bloomberg 09/03/26
Disclosures: Past performance is no guarantee of future results.
Less Interest Rate Sensitive
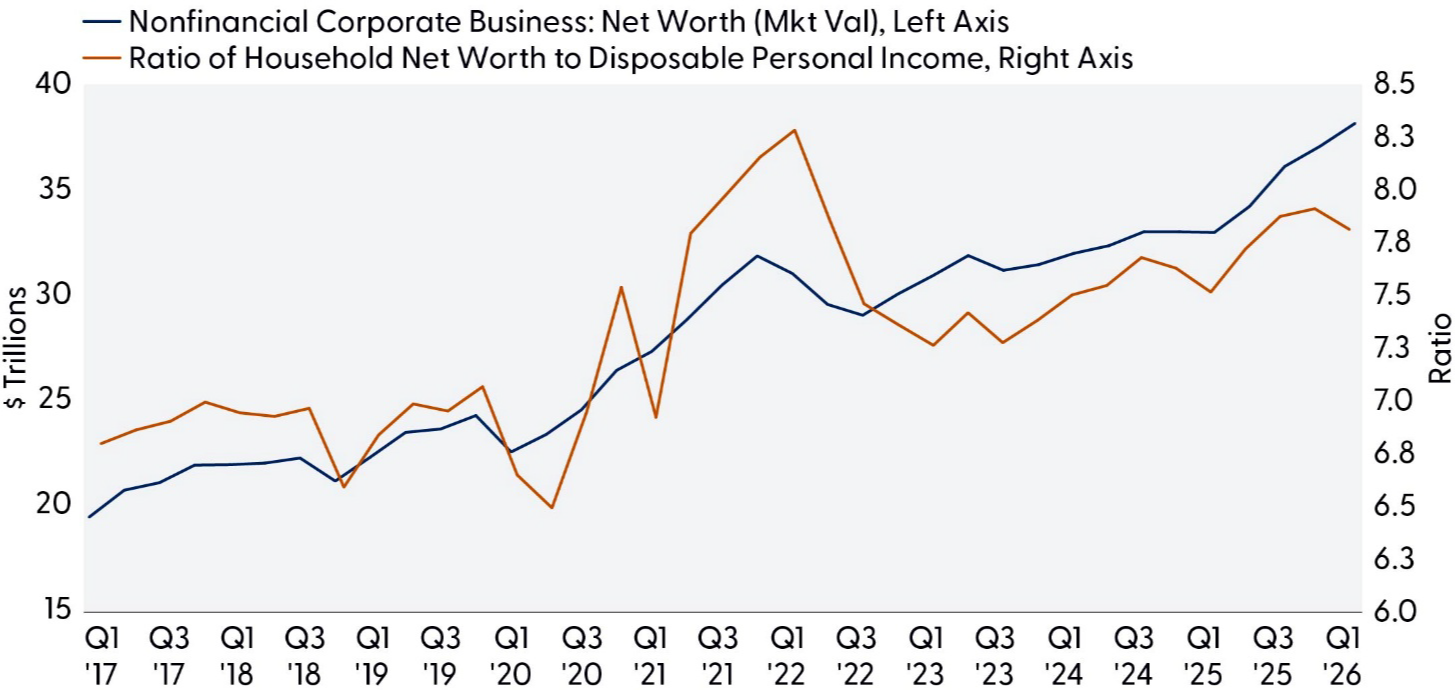
Elevated household net worth relative to income remains an important buffer for consumers, helping support demand despite persistent cost pressures and softer labor-market sentiment. Gains in asset prices over recent years including equities and home values have lifted balance sheets, leaving households with a greater cushion to absorb higher costs for essentials, such as food, energy, and services. According to recent Fed data, the ratio of household net worth to disposable personal income is higher than pre-COVID-19 levels and explains why the economy is holding up amid the headwinds.
Rising wealth can support consumption in the coming quarters by allowing consumers to draw on savings, tap home equity, or maintain confidence in their financial position despite real income pressures. One risk, however, is a market correction, since the wealth effect can also work in reverse. When geopolitical uncertainty rises or asset prices fall, consumers and businesses often reassess spending habits. Although higher interest rates may constrain some forms of borrowing, the overall strength in net worth relative to income helps mitigate downside risks to spending. As a result, consumer demand has shown resilience, even in the face of elevated inflation, supported in part by these stronger balance sheet dynamics.
Rising Net Worth Dampens Impact from Higher Rates
Source: LPL Research, Federal Reserve 09/14/26
Disclosures: Past performance is no guarantee of future results.
Fixed-rate mortgages and healthy household balance sheets have weakened the economy's traditional sensitivity to monetary policy as compared to just a few decades ago. As we wonder how the Federal Open Market Committee will vote throughout the course of this year and into the next, investors can take some solace that the economy is becoming less sensitive to interest rates. That means nominal growth can continue even if the Fed fails to cut rates or outright increases them.
Higher interest rates aren't packing the punch they once did. Despite mortgage rates remaining near multi-decade highs, many households continue to benefit from loans refinanced or originated during the pandemic-era period of exceptionally low borrowing costs. As a result, the Fed's rate hikes have had a more muted effect on household cash flows than in prior cycles. The evidence is showing up in debt-service burdens as of March 2026, consumer debt-service payments accounted for just 5.29% of disposable personal income, while mortgage debt-service payments stood at 5.88%. Those figures remain relatively modest by historical standards and help explain why consumer spending has proven resilient even as borrowing costs have surged.
Put simply, the vast stock of fixed-rate mortgages locked in at rates near 3% has insulated many homeowners from today's higher rates, weakening one of the traditional channels through which monetary policy slows economic activity. The result is an economy that appears less interest-rate sensitive than in previous tightening cycles, requiring larger or longer-lasting rate moves to produce the same cooling effect on growth.
Conclusion
In the United States, the economy continues to show surprising resilience despite restrictive monetary policy. Manufacturing activity is improving, business surveys point to steady demand, and a surge in investment tied to artificial intelligence and datacenter construction is providing a powerful tailwind for growth. Equally important, households have proven far less sensitive to higher borrowing costs than many economists expected. Strong balance sheets, historically low debt-service burdens, and a large stock of fixed-rate mortgages locked in during the pandemic have muted the traditional impact of Fed tightening. As a result, the economy appears capable of growing near 2% even as markets price in the possibility of additional rate increases. Higher rates alone rarely end bull markets. Historically, trouble for equities emerges when rising yields coincide with rising recession risk. Today, recession risks remain relatively low, suggesting the recent move higher in rates is more likely a headwind than a bull market-ending event.
The technical backdrop suggests the path of least resistance for yields remains higher, but the 5% level on the 10-year Treasury will be a critical test for the uptrend. For equities, the greater risk is not necessarily higher rates, but how quickly they rise, as rapid yield increases tend to tighten financial conditions and weigh on risk appetite.
Asset Allocation Insights
LPL's Strategic and Tactical Asset Allocation Committee (STAAC) maintains its recommendation for a tactical equity overweight and fixed income underweight. We believe an improving macro backdrop and sustained Al-driven earnings growth will continue to support the broader equity market through the remainder of 2026. The Committee recently shifted the implementation of the equity overweight from low-volatility strategies to a quality-factor tilt to enable greater upside participation and allow portfolios to diversify between the Al theme and potential rotation beneficiaries. We continue to favor the industrials and energy sectors, providing a modest tilt toward value-style industry groups. Industrial companies offer a lower beta way to benefit from the Al infrastructure buildout, while an energy overweight offers a desirable hedge against potential additional disruptions to global energy production and shipping.
On the fixed income side, we remain neutral relative to benchmark duration. In credit, we prefer to stay up-in-quality and resist the temptation to reach for spreads in a market where Al-related issuance is already filling the index with long, tight, single-name concentration. Agency mortgage-backed securities (MBS) are the relative value beneficiary if buybacks and a contained 30-year keep rate volatility from breaking out. Securitized sectors (asset-backed securities and select collateralized mortgage-backed securities) benefit as well. And for diversification purposes, non-U.S. developed and emerging market debt increases income opportunities.
Jeffrey Buchbinder, CFA, Chief Equity Strategist
Jeffrey Roach, PhD, Chief Economist
Adam Turnquist, CMT, Chief Cross-Asset Strategist
Important Disclosures
This material is for general information only and is not intended to provide specific advice or recommendations for any individual. There is no assurance that the views or strategies discussed are suitable for all investors or will yield positive outcomes. Investing involves risks including possible loss of principal. Any economic forecasts set forth may not develop as predicted and are subject to change.
References to markets, asset classes, and sectors are generally regarding the corresponding market index. Indexes are unmanaged statistical composites and cannot be invested into directly. Index performance is not indicative of the performance of any investment and do not reflect fees, expenses, or sales charges. All performance referenced is historical and is no guarantee of future results.
Any company names noted herein are for educational purposes only and not an indication of trading intent or a solicitation of their products or services. LPL Financial doesn't provide research on individual equities.
All information is believed to be from reliable sources; however, LPL Financial makes no representation as to its completeness or accuracy.
All investing involves risk, including possible loss of principal.
US Treasuries may be considered "safe haven" investments but do carry some degree of risk including interest rate, credit, and market risk. Bonds are subject to market and interest rate risk if sold prior to maturity. Bond values will decline as interest rates rise and bonds are subject to availability and change in price.
The Standard & Poor's 500 Index (S&P500) is a capitalization-weighted index of 500 stocks designed to measure performance of the broad domestic economy through changes in the aggregate market value of 500 stocks representing all major industries.
The PE ratio (price-to-earnings ratio) is a measure of the price paid for a share relative to the annual net income or profit earned by the firm per share. It is a financial ratio used for valuation: a higher PE ratio means that investors are paying more for each unit of net income, so the stock is more expensive compared to one with lower PE ratio.
Earnings per share (EPS) is the portion of a company's profit allocated to each outstanding share of common stock. EPS serves as an indicator of a company's profitability. Earnings per share is generally considered to be the single most important variable in determining a share's price. It is also a major component used to calculate the price-to-earnings valuation ratio.
All index data from FactSet or Bloomberg.
This research material has been prepared by LPL Financial LLC.
Not Insured by FDIC/NCUA or Any Other Government Agency | Not Bank/Credit Union Guaranteed | Not Bank/Credit Union Deposits or Obligations | May Lose Value
RES-0007122-0526 Tracking #1174218 | #1174219 (Exp. 09/27)